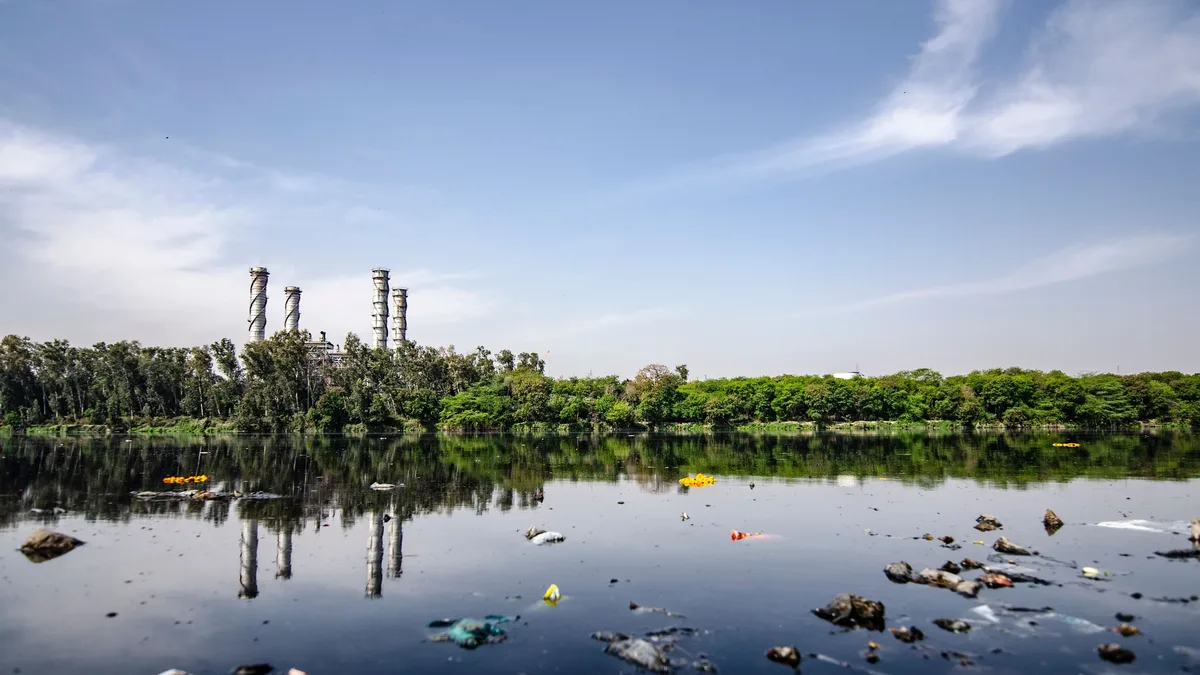
China's August Emissions Fall as Renewables Cover Power
A new analysis shows China's emissions declined broadly in August 2026, with fossil fuel use and industrial output weakening.
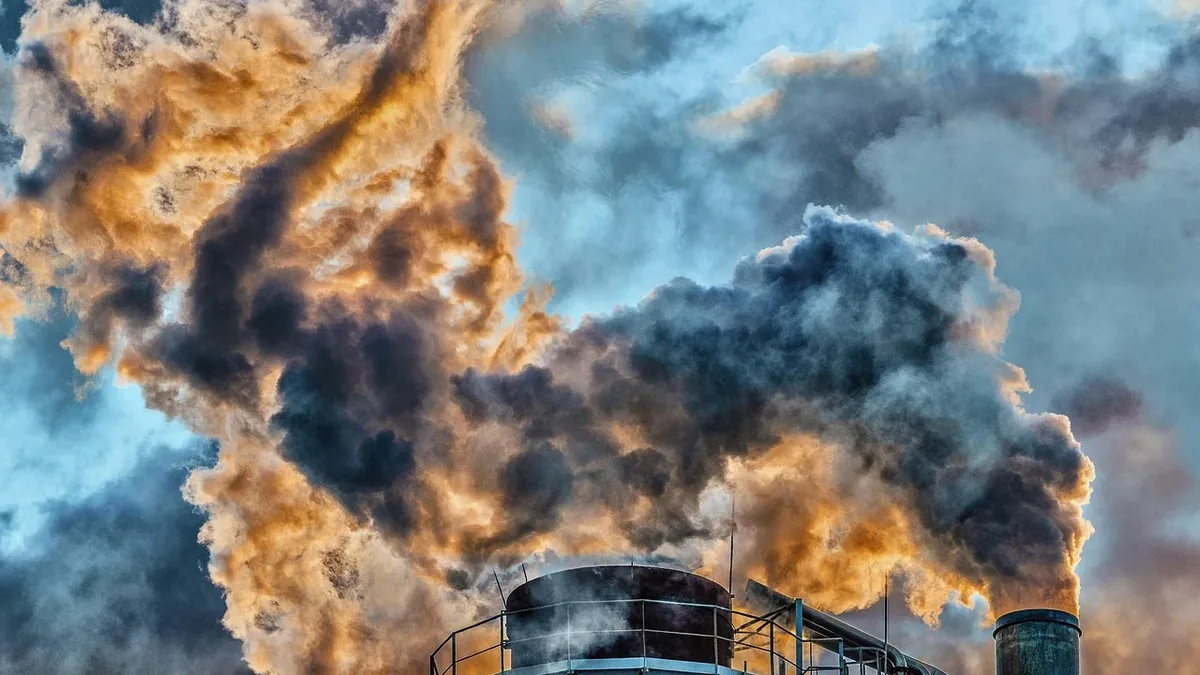
China's carbon emissions fell across multiple sectors in August 2026, according to a snapshot from the Centre for Research on Energy and Clean Air (CREA). Fossil fuel use and industrial activity in power, steel, cement, and refining all weakened. Meanwhile, manufacturing of batteries, solar cells, and new energy vehicles stayed strong.
Thermal power generation dropped 4% compared to August 2025. Increased generation from solar and wind covered all growth in electricity demand for the month. Hydropower and nuclear output also rose.
Fossil Fuel and Power Trends
Coal power generation fell for the second consecutive month, declining 5.2% year-on-year. This follows 2025, which saw China's coal power generation fall for the first time in a decade. Gas power generation rose 7.2%, but its minor role in the power mix limited the overall impact. Solar generation increased 17.1%, and wind generation rose 6.9%, rebounding from earlier poor conditions.
Fossil fuel supply remained subdued. Coal production fell 7.7% year-on-year in August, and coal imports dropped 1.5%. Crude oil imports hit a four-month high but were still 23% below August 2025 levels. Natural gas imports fell 13%.
Industrial Output Contracts
Output from major carbon-intensive industries continued to contract. Cement production fell sharply by 11.7% year-on-year, staying at its lowest August level since 2020. Crude steel output dropped 3.7%, and refinery throughput was down 6.9%. The report links the cement decline to a shrinking real estate sector.
Sulfuric acid output fell 15.5%, which analysts attribute to shipping disruptions affecting supplies for fertilizer production. Chemical fibre output decreased 3.2%. In early September, daily output of pig iron and crude steel hit multi-year lows for that time of year.
Clean Tech and Capacity Additions
Clean-tech manufacturing showed strength. Battery production surged 70% year-on-year. Solar cell output in the first eight months of 2026 remained on track to exceed the total global solar installation level for 2025. New energy vehicle (NEV) production expanded 21.9% in August, accounting for 61% of all vehicles produced. NEV export growth more than doubled.
Despite the monthly emissions drop, thermal power capacity additions accelerated sharply. In the first seven months of 2026, China added 50.3 gigawatts of thermal power capacity, a 20% year-on-year increase and the highest level for that period in 15 years. Additions were particularly strong in Anhui, Guangdong, Hebei, and Sichuan. The report expects 2026 to be one of the highest years on record for new coal power capacity.
Renewable capacity additions slowed from 2025's exceptional highs. The following table shows capacity additions for the first seven months of 2026.
| Power Source | Capacity Added (GW) | Change from 2025 |
|---|---|---|
| Solar | 86.1 | Down 61% |
| Wind | 47.1 | Down 12% |
| Thermal | 50.3 | Up 20% |
| Hydro | 6.8 | Up 16% |
| Nuclear | 3.6 | Up from 0 GW |
In Tangshan, a major steel-producing city and a key source of regional air pollution, the operating rate of blast furnaces reached 94.3% in early September. Analysts note this is the highest level in several years. Hebei Province, where Tangshan is located, is often the most tightly regulated area for industrial output when air quality is a priority due to its impact on pollution levels in Beijing.
The data comes from CREA's China Energy and Emissions Trends report. Figures for the most recent month are preliminary model estimates and may be revised once official data is released.